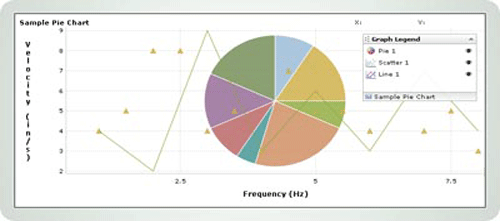
Here, we have come up with an interesting round up of some beautiful visualization libraries. Presenting collected data to the users is a very common need in web application or software. There was a time when data was presented simply through numbers and words even the complicated data like traffic statistics and clicking hits. That was pretty simply method. Now, time has changed and so the methods of presenting data to the users. These days, presenting data in plain words or numbers do not seem effective at all.
Showing posts from Category: Charts
show all postsThanks to all of the participants of contest in which Visifire – Windows Phone 7 (WP7) Charting Tools were givingaway. We ran the MySQL random query and selected these comments to give them Visifire.
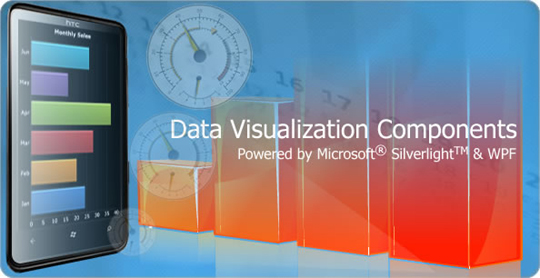
Visifire is a set of data visualization controls – powered by Microsoft®Silverlight™ & WPF. Visifire is a multi-targeting control which can be used in both WPF & Silverlight applications. Use the same API to create charts & gauges in Mobile, Web & Desktop environments. Visifire Silverlight Controls can also be embedded in any webpage as a standalone Silverlight App. Visifire is independent of server side technology. It can be used with ASP, ASP.Net, SharePoint, PHP, JSP, ColdFusion, Python, Ruby or just simple HTML. You can visit Visifire Gallery or design your own chart or gauge using Chart/Gauge Designer.
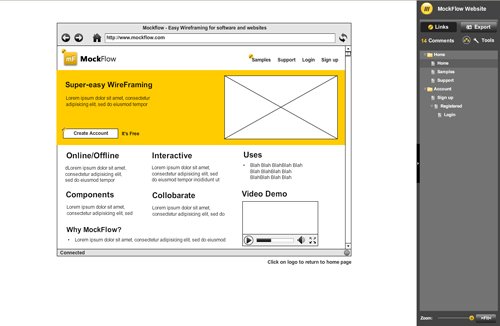
A wireframe or mockup tool is a must have tool for every web designer and developer. These tools have their importance in web designing and development world. It is good to use them because it saves your time and efforts, a mockup or wireframe can give you the whole idea about how your web will look and work. Combination of your own creativity and client’s requirement into a blank canvas, allows you to effectively plan the visual arrangements of the site’s contents. Well, a good and reliable wireframing application will cost you for sure and cost can starts from 150$ to 5000$. So, are you going to buy or what? and I definitely heard a big NO out there. So, my friends here comes the solution to the problem, I am listing some good web apps and tools for you in my article and you can use these mockup and wireframe apps and tools for FREE.
Have you ever made use of simple point-to-point graphs? You will be surprised with how useful they can be. Imagine yourself at the doctor’s. You are there because of your backache. The doctor asks you about how severe the backache has been the past week. You show him a graph on which you have plotted the pain degree of every day. It can be immensely helpful to your doctor.
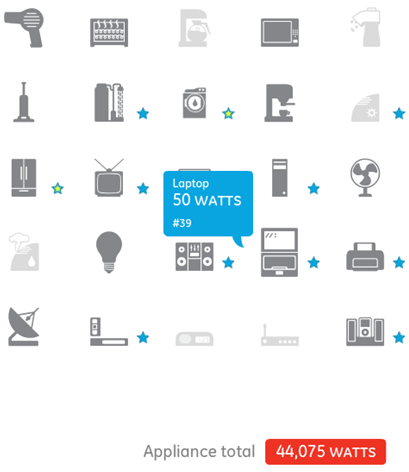
Leaving our appliances on while we are not using them is a terrible waste of electrical power. There are parts of the world that do not have electricity at all; we should do our part to respect the resources we have and save them whenever / wherever we can.
Below you will find a list of 7 tools to prevent wasting electrical power. I believe that each entry in the list serves a useful purpose; read about each one and choose the one (or more than one) that suits you best.
People with a lot of money hire financial advisors to monitor their spending and point out the rights and wrongs in that spending. The money that is saved from correcting the wrongs is then invested into potentially profitable ventures to benefit the client.
However the percentage of people who are that rich is considerably low. Most people are like me, not rich enough to hire external help. We have to manage our own finances and catch our own mistakes. Doing this single-handedly can be quite a task; an extra bit of help can end up benefiting us a lot.
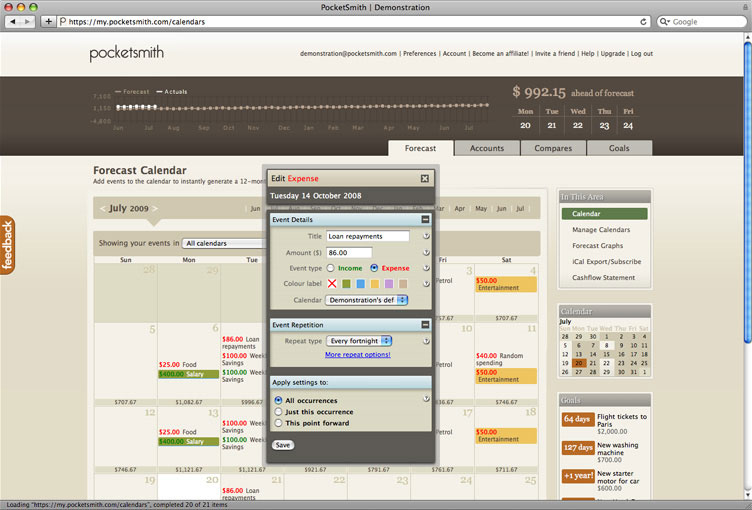
PocketSmith is a free web service and one of those “extra bits of help” which we can employ to manage our finances. It basically acts as a calendar which we can feed our expenses in and which can forecast our future cash positions.
We are always in search of great free resources, tips, tricks, etc. for our readers. Every day we work hard to find new resources and inspiration for designers like you. Today, we have another great post, “Discover the Best of the Web” on SmashingApps. In this, we made a list of 75+ Truly Useful Tutorials & Colorful Resources For Designers. We obviously cannot cover all the best from the web, but we have tried to cover as much as possible.
If you have a non-commercial website and you need to add charting capabilities in your website, Highcharts may suit your needs. Highcharts is a free charting control developed purely with Javascript so that you can show interactive charts on your website. Since its purely developed with Javascript, you don’t need any special server side technologies like ASP.NET or PHP and no client-side plug-ins are required like Flash or Silverlight.
We are always in search of great free resources, tips, tricks, etc. for our readers. Every day we work hard to find new resources and inspiration for designers like you. Today, we have another great post, “Discover the Best of the Web” on SmashingApps. In this, we made a list of 80+ Incredible Collection Of Inspirations, Tutorials And Resources For Designers. We obviously cannot cover all the best from the web, but we have tried to cover as much as possible.
ClickMeter is an essential tool to track results from the small blog to a full-fledged marketing campaign. This is versatile, scalable and easy to use tool to track how many clicks you have got on your external links. You can enjoy reliable real-time statistics over suspect click-fraud activity: filter per campaign; customize fraud-detection parameters and compare results for multiple campaigns in a single chart. The best about this tool that it has absolutely FREE plan with huge list of amazing features.
We are always in search of great free resources, tips, tricks, etc. for our readers. Every day we work hard to find new resources and inspiration for designers like you. Today, we have another great post, “Discover the Best of the Web” on SmashingApps. In this, we made a list of 85+ Excellent Resources And Tutorials Especially For Designers. We obviously cannot cover all the best from the web, but we have tried to cover as much as possible.
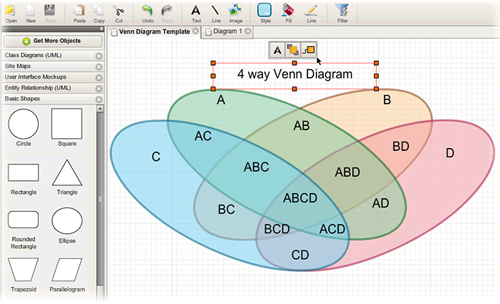
Today, we are listing The Five Best Online Diagramming Tools. These would be very helpful for you to create professional looking diagrams, such as flowcharts, sitemaps, organisation charts, wireframes, and many more. If you are designer, developer, office worker, manager, supervisor, student, home user, etc but we hope that these are worth checking for all of you. Most of them are not very well known but they are really amazing in respect to their features. Just take a look at them and share your thoughts here.
We are always in search of great free resources, tips, tricks, etc. for our readers. Every day we work hard to find new resources and inspiration for designers like you. Today, we have another great post, “Discover the Best of the Web” on SmashingApps. In this, we made a list of 70+ Promising Resources and Tutorials Especially For Designers. We obviously cannot cover all the best from the web, but we have tried to cover as much as possible.
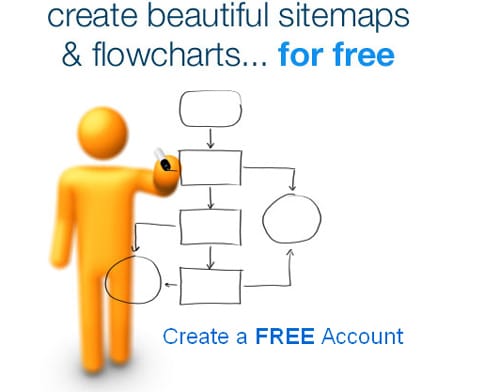
SlickPlan is a web-based sitemap/flowchart generator that allows for the creation of free sitemap and flowchart design. SlickPlan was handcrafted with PHP/MySQL and jQuery. It was exclusively developed with the web designer and developer in mind, but it can be used by anyone who needs a quick and professional sitemap or flowchart for their planning project.
In past, we have listed various free web apps that are really useful for any one of you. Today, we have a new post that has simplest free web apps that can really simplify your work life. Whether you are office worker, manager, supervisor, designer, developer, student, home user, etc. But we make sure to add something useful for everyone. Most of them are not very well-known, but they are really amazing in respect to their features. Just take a look at them and share your thought here.
We are always in search for the great free resources, tips, tricks, etc. for our readers. Everyday we work hard to find new and useful stuffs for designers like you. Today, we have another great post for designers with a great collection of freebies stuffs like Icons, Fonts, Vectors, Brushes, Textures, Patterns and PSDs and much more. We obviously cannot cover all of the best available on internet, but we have tried our best to cover as much as possible.
Plotting your data can serve as a replacement to tabular data, and is also a great way to add practical graphics to your web page or application. There are many ways you can plot data, but here I have included 20 Really Useful Scripts To Plot Charts In Your Sites/Blog Pages which serves as a easy Charting solution. Hope you like it.
Widgenie empowers everyone, from bloggers to business people, to quickly visualize data and share it in many different ways. Now you can publish data in the places you already know and love, places like iGoogle, Facebook, Blogger, and even your own website. They combine all the power of an enterprise-level business intelligence platform and provide it in a convenient Web 2.0 widget. Best of all, you can do it all by yourself! And it’s free.
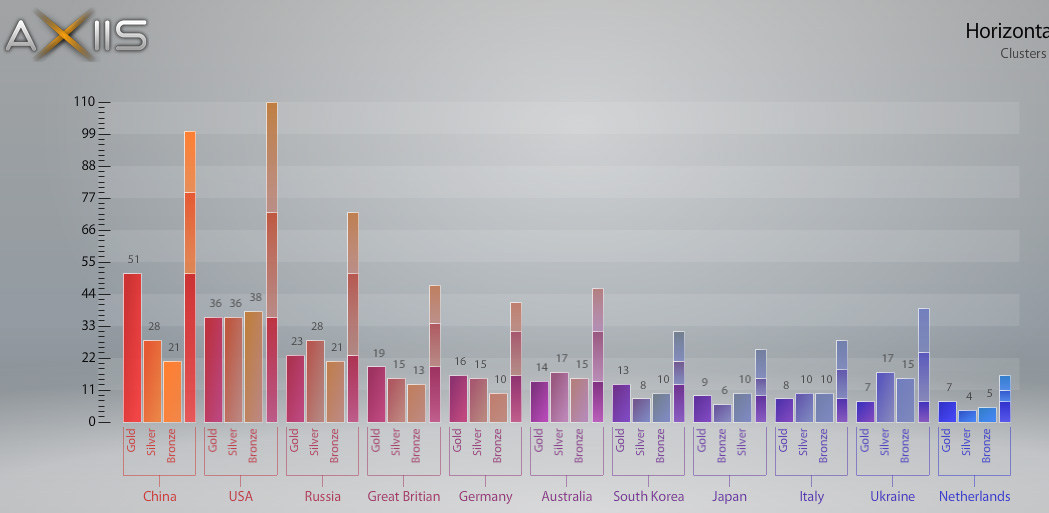
Axiis is an open source data visualization framework designed for beginner and expert developers alike. Whether you are building elegant charts for executive briefings or exploring the boundaries of advanced data visualization research, Axiis has something for you. It gives developers the ability to expressively define their data visualizations through concise and intuitive markup. Axiis has been designed with a specific focus on elegant code, where your code can be just as beautiful as your visual output. By leveraging {inline} Flex Binding and the Axiis markup syntax you don’t need to write volumes of code to produce amazing results. In fact, some of the more complex Axiis examples have no more than 200 lines of code.

