Now loading...
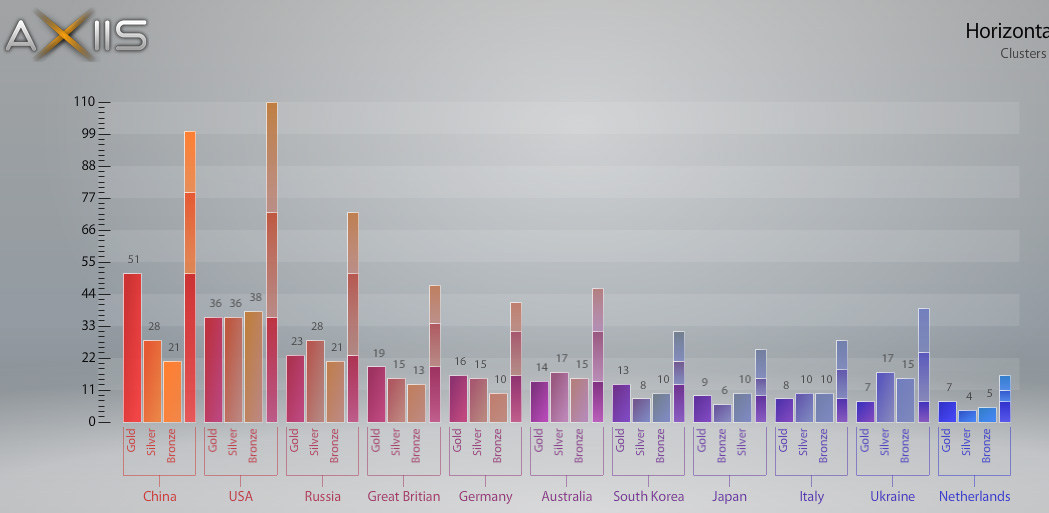
Axiis is an open source data visualization framework designed for beginner and expert developers alike. Whether you are building elegant charts for executive briefings or exploring the boundaries of advanced data visualization research, Axiis has something for you. It gives developers the ability to expressively define their data visualizations through concise and intuitive markup. Axiis has been designed with a specific focus on elegant code, where your code can be just as beautiful as your visual output. By leveraging {inline} Flex Binding and the Axiis markup syntax you don’t need to write volumes of code to produce amazing results. In fact, some of the more complex Axiis examples have no more than 200 lines of code.
Axiis was designed to be a granular framework, allowing developers to mix and match components and build complex output by compositing together basic building blocks. We have specifically avoided long OO inheritcance chains to keep our classtructures flat and interchangeable. In Axiis you create visual complexity through engineering simplicity.
Axiis is an open source project, under an MIT license. This means you can use it for personal projects, commercial work, and pretty much anything you can think of with no restrictions, we just ask you keep our copyrights and license within the code.
Now loading...


