Now loading...
In this post, we are sharing 14 best tools for data visualization that helps end users not only with the ability to view all types of data but also let them better understand this data. These tools will be very helpful for the developers as these days clients demand regarding data infographics.
Today, we want to dig into some creative ways you can put data visualization in the web design. We hope that this compilation will draw new ideas to inspire and improvise the ordinary designs. Here is the complete list of 14 best tools for data visualization. We hope you will like this collection. Enjoy!
With this widget, you can make beautiful interactive timelines like the one below. Try dragging it horizontally or using your mouse-wheel.
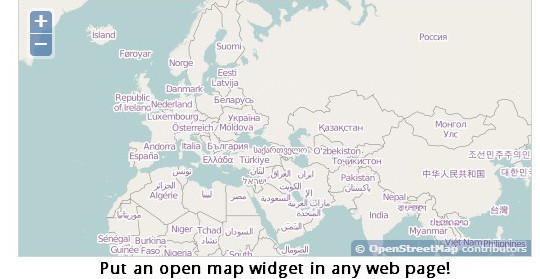
Modest Maps is a small, extensible, and free library for designers and developers who want to use interactive maps in their own projects.
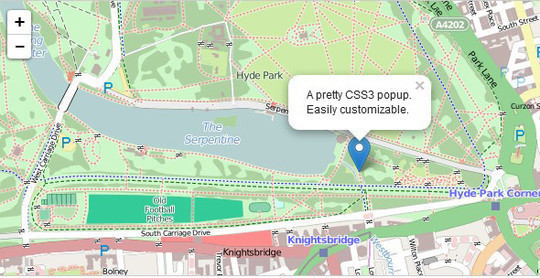
Leaflet is a modern open-source JavaScript library for mobile-friendly interactive maps.
Wolfram|Alpha is more than a search engine. It gives you access to the world’s facts and data and calculates answers across a range of topics, including science, nutrition, history, geography, engineering, mathematics, linguistics, sports, finance, music…
Visualize Free is a free visual analysis tool based on the advanced commercial dashboard and visualization software developed by InetSoft, an innovator in business intelligence software since 1996.
A Versatile and Expandable jQuery Plotting Plugin!
A JavaScript visualization library for HTML and SVG.
The JavaScript InfoVis Toolkit provides tools for creating Interactive Data Visualizations for the Web.
Highcharts – Interactive JavaScript charts for your web pages.
Fast n-dimensional filtering and grouping of records.
Kartograph is a simple and lightweight framework for building interactive map applications without Google Maps or any other mapping service.
Flot is a pure JavaScript plotting library for jQuery, with a focus on simple usage, attractive looks and interactive features.
Now loading...


